
JOSHUA PETER
Data Analyst
About Me
Hi I’m Josh and I’m a Data Analyst 📊I turn data into insight uncovering patterns 📈, tracking performance, and helping teams make confident, informed decisions. From cleaning datasets and building dashboards to telling the stories behind the numbers, I enjoy every step of the process.I focus on delivering work that’s clear, reliable, and actionable 💡, helping businesses streamline reporting, understand their performance, and make decisions backed by data.
Skills

Power BI | SQL | Excel | Python
Business Analytics
Data Visualisation
Report Development
Presentation Deck Creation
Problem Solving
Collaboration
Featured Projects

HR AnalyticsPOWER BI
Carried out an HR analysis using Power BI to analyse workforce diversity, performance, and attrition, supported by a consulting-style slide deck with targeted retention strategies to reduce attrition and improve employee experience.
Churn Analysis DashboardPower Bi
Developed a Power BI dashboard analysing telecom customer churn across demographics, contract types, and service usage, accompanied by a McKinsey-style presentation outlining targeted retention strategies.


SQL Database for a Footwear Retail StartupSQL
Developed a SQL database for a start-up footwear retail store, improving data integrity, enabling SQL insights on sales and performance, and supporting data-driven decisions through stored procedures and performance tuning.
Football Scouting: Player Similarity & Valuation ModelsPython
Built K-Means and Random Forest models to enhance football scouting by identifying similar players to a given player and predicting market values, helping clubs make data-driven recruitment decisions.

Education

MSc Data Science & Artificial Intelligence | October 2024

BSc Management | July 2021
Power Bi | HR Analytics
Summary
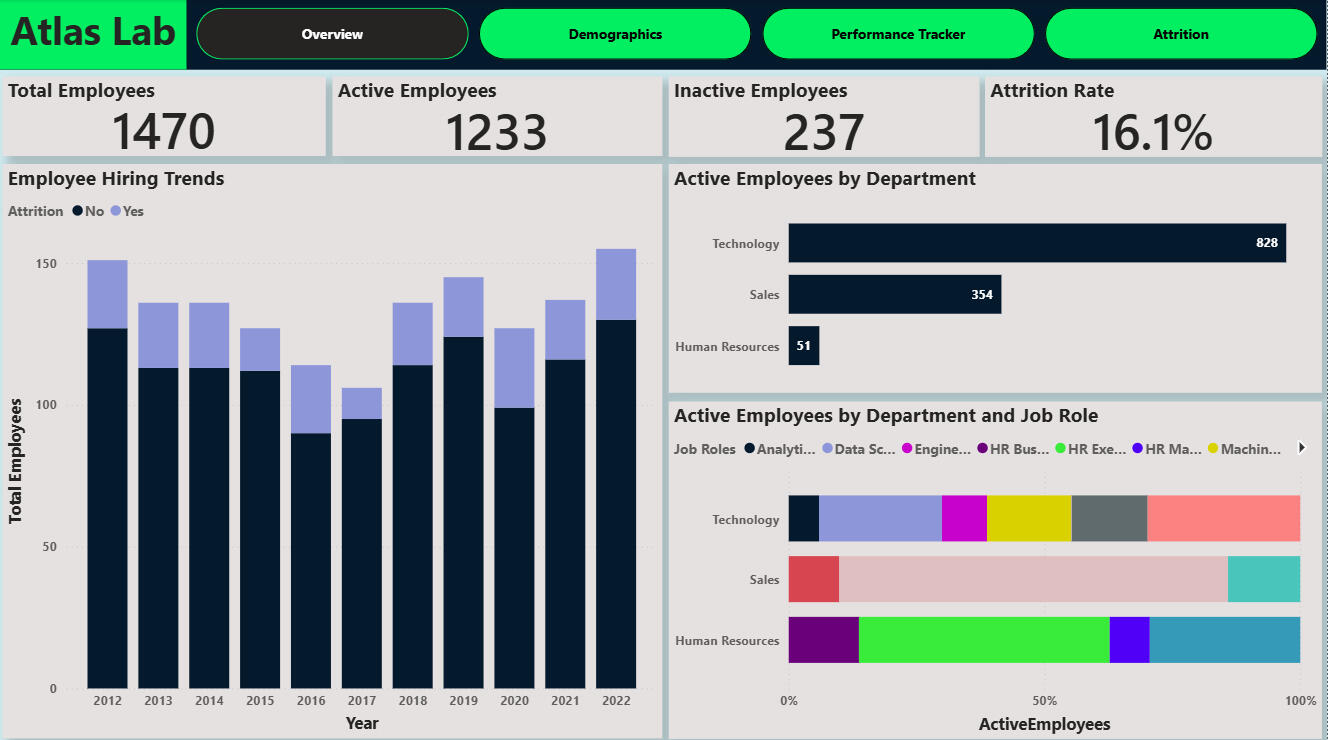
Five datasets were combined to build this Power BI HR Analytics report. The data included a Performance table containing employee reviews, satisfaction, and rating metrics. Employee table with detailed staff information, as well as supporting tables for Satisfaction Level, Rating Level, and Education Level.
The report was developed to analyse workforce demographics, hiring trends, and attrition at Atlas Labs.Questions I was Interested in answering
* What is the composition of Atlas Labs’ workforce across demographics, departments, and job roles?
* Which roles, demographics, or working conditions show the highest levels of attrition?
* At what stage in the employee lifecycle is attrition most common, and why?
* What data-driven actions can improve employee retention, experience, and engagement at Atlas Labs?Steps I took
* Imported the CSV files into Power BI and prepared the data, ensuring correct data types across all fields and no duplicates.
* Created a Date table to support time-based analysis.
* Created a conditional AgeBins column on the Employee table to group ages.
* Modeled the data using a snowflake schema, choosing the Performance table as the fact table.
* Implemented DAX measures and calculated columns to analyse employee counts, attrition, salary insights, performance scores, hiring cohorts, and more.
* Designed an interactive HR Analytics dashboard.
* Designed a consulting-style slide deck, highlighting root causes of attrition and outlining data-driven retention strategies.


Key takeaways
* Workforce Size: Atlas Labs has hired 1,470+ employees, with 1,200+ currently active.
* Diversity: Balanced gender representation +2.7% more women and 8.5% non-binary employees reflect an inclusive workforce.
* Diversity: Vast ethnic diversity but high attrition amongst minority-represented ethnicities.
* Attrition Rate: Overall attrition stands at 16%, with Sales Representatives (≈39.8%), Recruiters (≈37.5%), and Data Scientists (≈23.8%) most affected.
* Attrition Drivers: 74.5% attrition for employees required to do overtime.24.9% attrition for roles requiring frequent travel.66% of exits occur within the first 2 years of employment.


Recommendations:
* Implement 30–60–90 onboarding with success checkpoints.
* Assign peer mentors and run early pulse surveys.
* Review travel and cap overtime in Sales, Recruiting and field roles.
* Train managers on coaching, feedback, and well-being leadership.
* Promote recognition and team practices to improve relationships and well-being.
* Run quarterly people analytics reviews to flag emerging risks.
Dashboard Interactivity
Dashboard Pages


Power Bi | Churn Analysis Dashboard
Summary
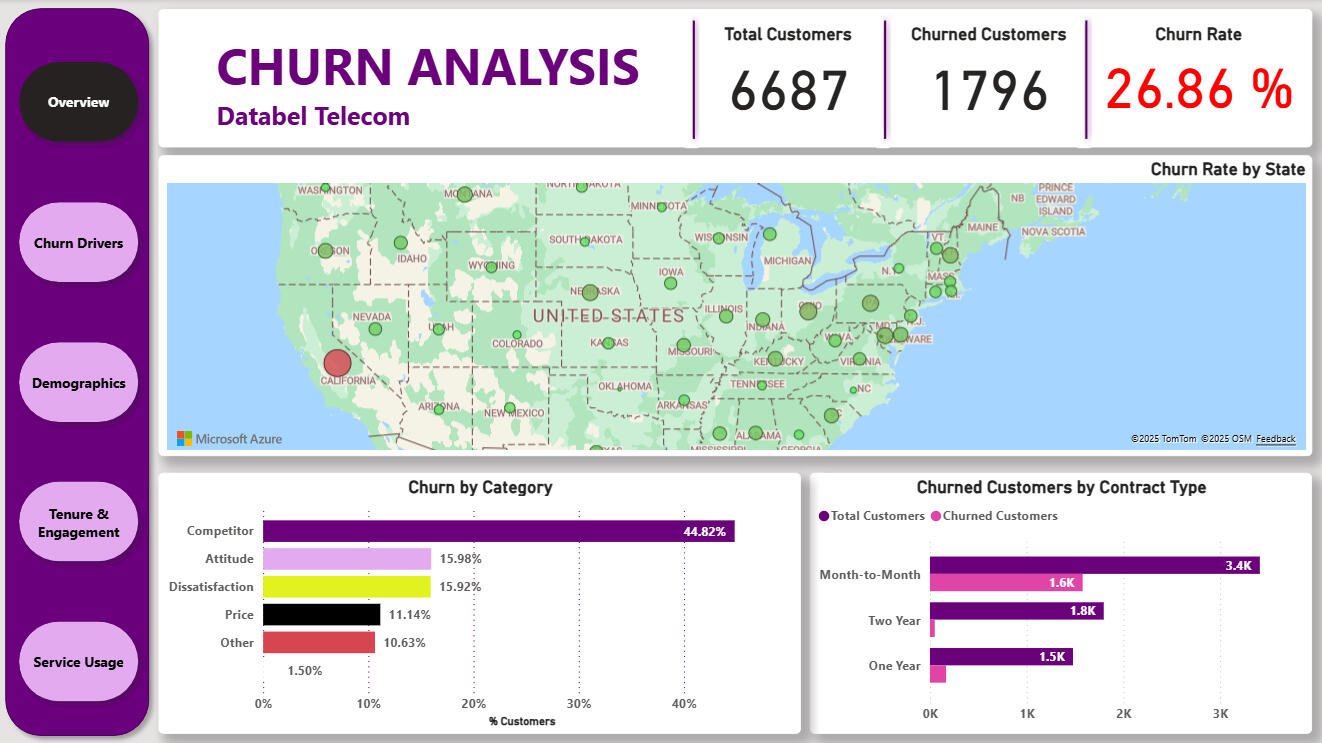
This Power BI project explores customer churn at Databel Telecom, uncovering how demographic, contractual, and usage factors affect customer retention. Using DAX measures and calculated columns, I modelled churn behaviour, visualised customer segments, and identified key churn drivers. Insights were summarised in a McKinsey-style presentation recommending data-driven strategies to reduce churn and improve customer loyalty.Questions I was Interested in answering
* What is Databel’s overall churn rate, and how does it compare to the industry average?
* Which customer segments (by age, contract type, or data usage) are most prone to churn?
* How do customer service interactions and competitor offers influence customer retention?
* What targeted strategies could Databel implement to reduce churn and strengthen loyalty?Steps I took
* Imported and prepared customer data in Power Query, ensuring correct data types for numerical fields and categorical fields.
* Created calculated columns for demographics (e.g., Age Category, Contract Category, Grouped Consumption) to segment customers by age, plan type, and data usage.
* Built DAX measures to calculate KPIs such as Churn Rate, Average Charges, Number of Customers, and Customer Service Calls per Customer.
* Designed an interactive five-page Power BI dashboard visualising churn by demographics, state, contract type, and data consumption.
* Interpreted insights and compiled them into a McKinsey-style presentation, translating analytical findings into practical retention strategies.Key takeaways
* Churn Rate: Databel’s churn rate was 29%, above the 20% industry average.
* Demographics: Seniors (aged 65+) represented 38.46% of total churn, the highest-risk group.
* Contracts: Monthly contract holders churned at 46%, compared to far lower churn among yearly plans.
* Reasons: 43.51% of churners cited competitor offers, with service dissatisfaction also a notable factor.
* Recommendations:
* Launch senior-friendly plans with perks and priority service.
* Encourage contract upgrades through loyalty rewards.
* Address high churn in states like California via improved support and localised incentives.
* Improve customer experience through faster support, staff training, and proactive feedback management.
Dashboard Interactivity
Dashboard Pages


SQL | Footwear Store Database
Summary
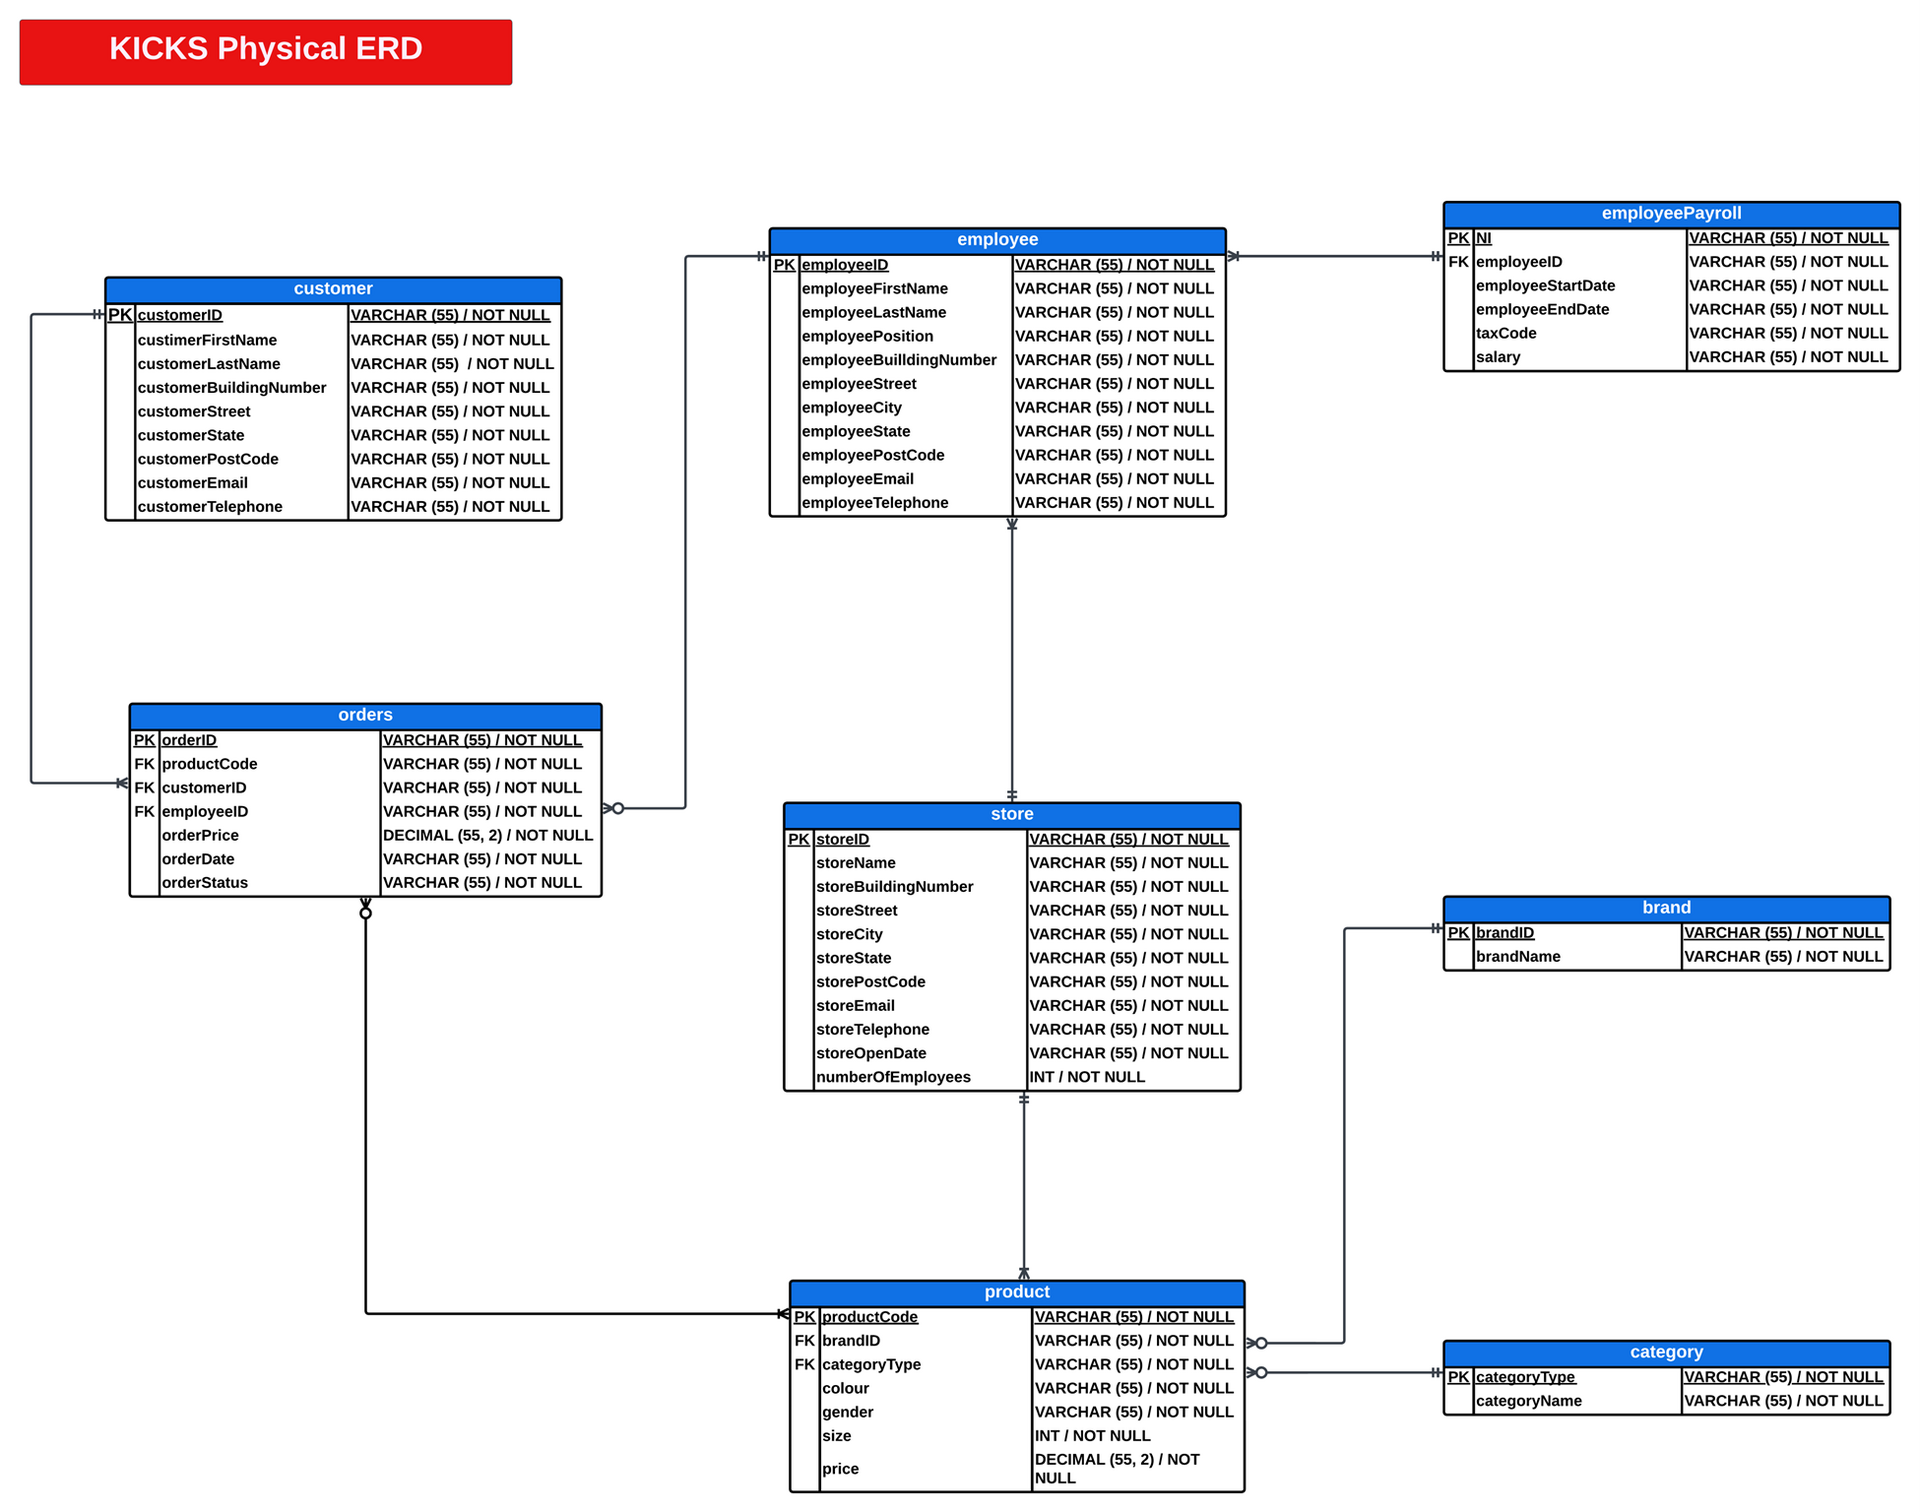
This project involved designing and implementing a complete SQL database for Kicks Ltd, a start-up footwear retail store. The system was built to replace an Excel-based workflow, enabling structured data storage, improved reporting, and analytical insights on sales, purchasing, and employee performance. The project included database design, SQL scripting, stored procedures, triggers, and optimisation.Questions I was interested in answering
* How can Kicks Ltd transition from spreadsheets to a scalable, relational database system?
* What insights can SQL analysis provide about sales performance, purchasing trends, and staff contribution?
* How can automation through stored procedures and triggers improve data accuracy and efficiency?
* What structure and constraints ensure data integrity, security, and consistency across the system?Steps I took
* Designed a fully normalised database schema in MySQL to manage customers, products, orders, suppliers, and employees.
* Created SQL tables with primary and foreign key constraints to enforce referential integrity.
* Developed 25+ analytical queries to extract insights on top-performing brands, products, and employees.
* Implemented stored procedures for key operations such as adding and removing employees.
* Introduced triggers to detect new hires and automatically send welcome emails.
Stored Procedures


Trigger

* Optimised performance using joins, aggregate functions, and views, reducing reporting latency by 40%.
* Secured the employeePayroll table by restricting access to HR, Payroll, and Finance users, ensuring GDPR compliance and stronger data protection.
* Produced backup and dump files for database recovery and documentation to ensure maintainability.
Optimisation, Security & Back Up


Featured Queries


Key takeaways
* Efficiency: Database structure significantly improved data retrieval speed and reporting accuracy.
* Insights: Analytical SQL queries revealed top-selling products, profitable brands, and leading employees.
* Automation: Stored procedures and triggers reduced manual data entry, improving consistency.
* Performance: Optimised joins and indexes decreased query runtime, enhancing overall responsiveness.
* Impact: The system provided Kicks Ltd with a scalable foundation for future analytics, replacing static Excel reports with a dynamic, query-driven data environment.
Machine Learning | Football Scouting: Player Similarity & Valuation ModelsPython
Summary
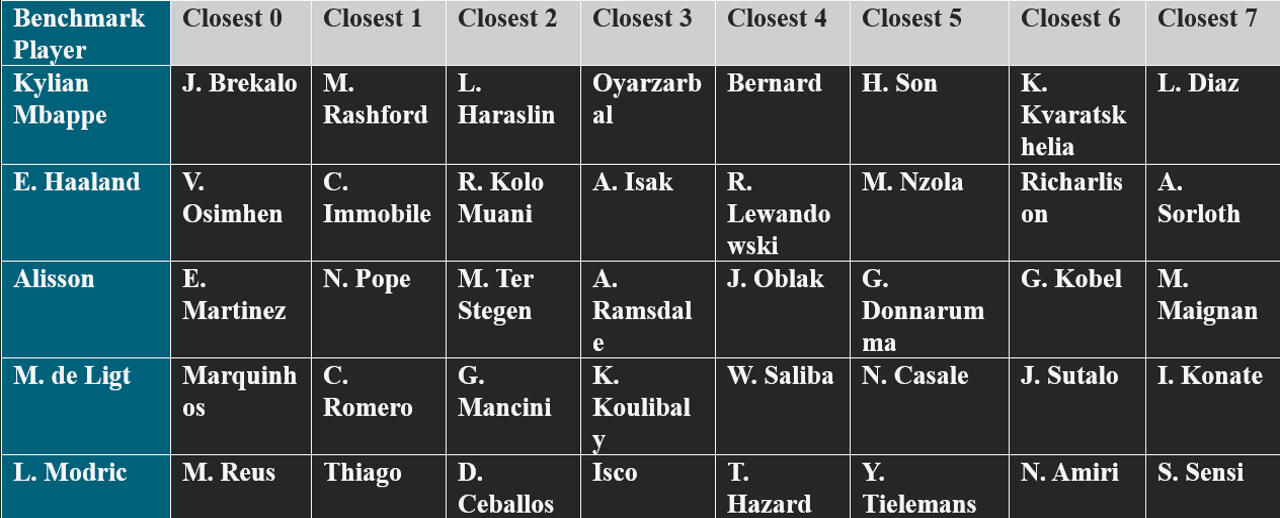
This project applies machine learning to football scouting and player valuation by combining clustering and regression techniques. Using player performance data, I built models that identify similar players to a given player and predict market value, helping clubs discover talent and make data-driven recruitment decisions.Research questions I was interested in answering.
RQ1: How can advanced data analysis be utilised to enhance traditional scouting methods and improve player scouting and recruitment in football?
RQ2: How can the player similarity and valuation models help clubs with limited financial resources or those constrained by FFP?Additional exploratory questions:
* Which metrics best distinguish player types across positions and styles?
* What key performance attributes most influence player market valuation in modern football?
* How can the combined use of player similarity and value prediction models support more objective, data-driven scouting and recruitment decisions?Steps I took* Data Preparation:
* Imported and merged multiple CSV datasets containing player attributes, performance stats, and market values.
* Handled missing values systematically:* For numerical columns, imputed missing data using the median, chosen for robustness against outliers.
* For categorical columns, replaced missing entries with the placeholder ‘Unknown’ to retain all data and prevent loss of diversity.
* Standardised numerical features using StandardScaler from scikit-learn to ensure balanced weighting across attributes for K-Means.
* Encoded categorical variables (e.g., player position) using one-hot encoding, allowing all categories—including ‘Unknown’—to be represented in the models.* Player Similarity (K-Means Model):
* Implemented a K-Means clustering model to segment players by key metrics such as goals, assists, passing accuracy, and defensive actions.
* Determined the optimal number of clusters via the Elbow Method and validated using a silhouette score of 0.67, indicating well-separated player groups.
* Used Principal Component Analysis (PCA) for dimensionality reduction and visual representation of clusters.
* Interpreted each cluster to identify player archetypes—creative midfielders, attacking forwards, defensive anchors, etc.—and potential transfer targets.* Player Valuation (Random Forest Regressor):
* Built a Random Forest Regressor to predict player market value based on performance, positional, and demographic features.
* Conducted feature selection to eliminate redundant or low-variance attributes.
* Tuned model parameters (n_estimators, max_depth, and min_samples_split) using GridSearchCV for optimal performance.
* Achieved R² = 0.88, MAE = 0.043, and RMSE = 0.073, demonstrating high predictive accuracy.
* Evaluated feature importance, revealing that goals, assists, and minutes played were the strongest valuation drivers.


Key takeaways
This project strengthened my ability to turn raw performance data into meaningful, actionable insight. I learned how clustering and predictive modeling can uncover patterns in player performance and support informed recruitment decisions. It reinforced the importance of well-prepared data, where careful cleaning, feature engineering, and scaling directly influence model quality. Above all, it showed how data science can bridge the gap between analytics and sports, transforming numbers into smarter decisions.